When your site goes down, the first thing customers want to know is whether it’s them or you. A public status page answers that, cuts support tickets, and shows you noticed before they did.
Uptime Kuma is an open-source (MIT) monitor that does both halves: it checks your services and publishes the results as a status page. Here’s the setup. There’s a broader tour in our Uptime Kuma guide.
Step 1: Add monitors
In Uptime Kuma, click Add New Monitor for each thing your users depend on:
- HTTP(s) for the website and each important page (
/,/login,/checkout). - HTTP(s) – Keyword to make sure the page contains expected text, not just a 200 from an error page.
- HTTP(s) – JSON Query for an API health endpoint that returns
{"status":"ok"}. - TCP port, Ping, or DNS record for infrastructure.
- Push for cron jobs and backups: the job calls a URL when it finishes, and Kuma alerts if it doesn’t.
Checks can run every 20 seconds; 60 seconds is plenty for a status page.
Step 2: Wire up alerts
Under Settings → Notifications, add a channel. Uptime Kuma supports more than 90, including Telegram, Slack, Discord, email (SMTP), and webhooks. Attach it to your monitors so you hear about outages before your users post about them.
Step 3: Publish the status page
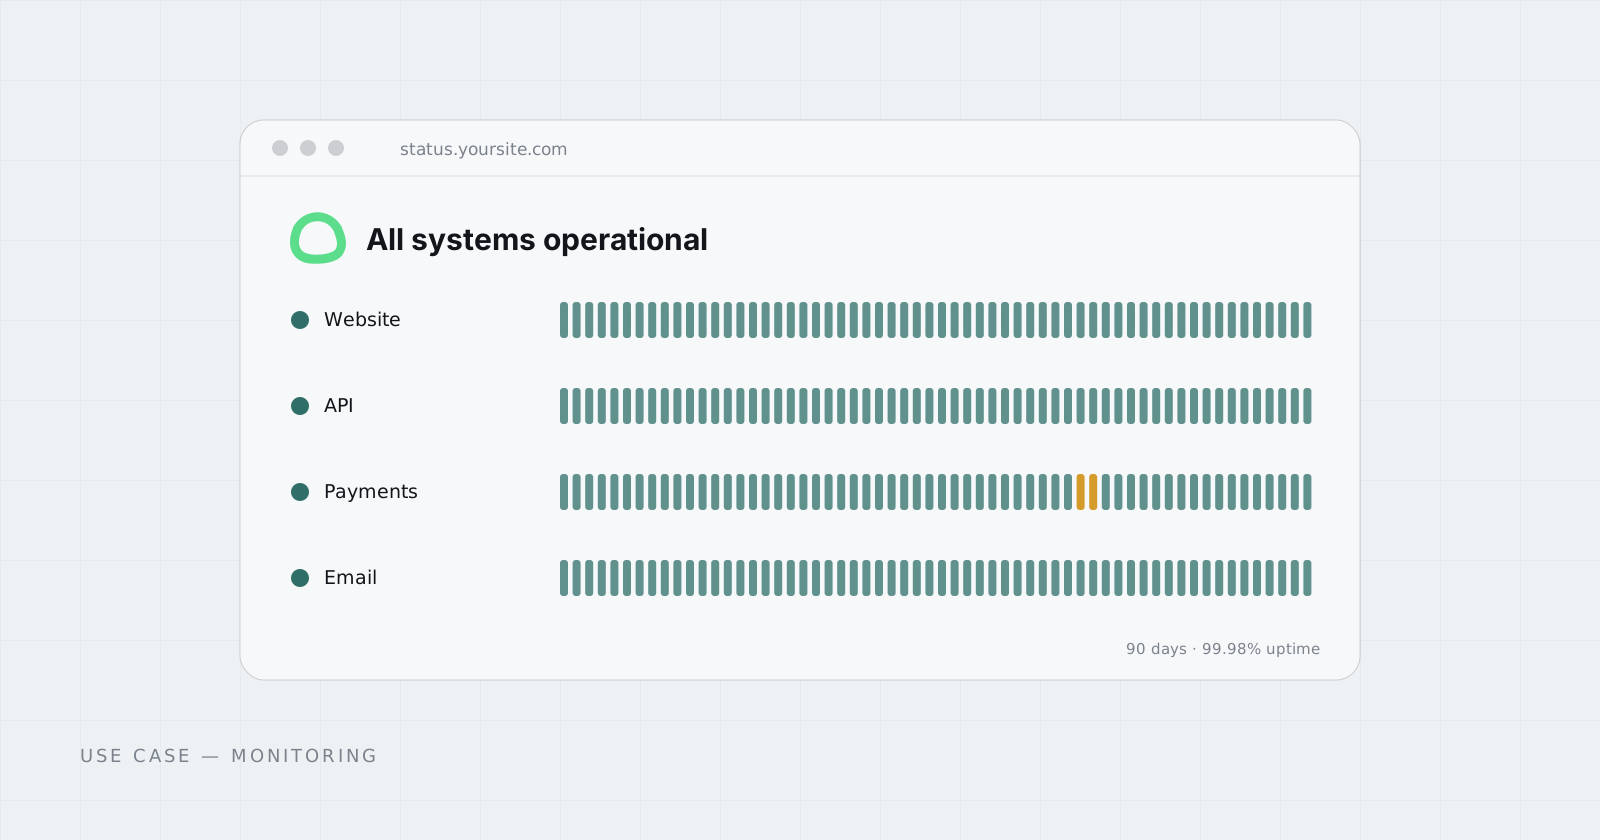
Go to Status Pages → New Status Page, give it a name and slug, and add your monitors in groups (“Website”, “API”, “Payments”). Each group shows current status and a 90-day history bar.
Use Incident to post a note during an outage, and Maintenance to schedule planned downtime, so the page says “planned” rather than “down”.
Step 4: Link it where people look
Every status page gets its own URL (/status/<slug>) on your Kuma instance. Link it from your site footer, help center, and error pages, so people find it in the moment they need it.
Uptime Kuma can also map a status page to a domain of your own, such as status.yourdomain.com. That needs DNS and TLS for the domain to point at your instance, which is easiest when you run the reverse proxy yourself.
Keep the monitor off the thing it monitors
A status page on the same server as your website goes down with it, at exactly the moment you need it. Run Uptime Kuma somewhere separate.
On Cadesia, Uptime Kuma runs in its own Pod with an HTTPS Address and persistent storage for monitor history, for $2.99 a month on the Starter plan. That’s the Website Monitor Solution, or pick it in the App Library. Weighing it against a hosted service? See UptimeRobot vs Uptime Kuma.
Questions
Can Uptime Kuma host several status pages?
Yes. You can create multiple status pages, each with its own set of monitors, and map each one to its own domain, for example status.example.com.
How often can Uptime Kuma check a site?
Checks can run as often as every 20 seconds. For a public status page, 60 seconds is a sensible default.
What happens if the monitor itself goes down?
Nothing alerts you, which is why the monitor should run somewhere separate from the sites it watches. A push monitor fed by an external cron job can act as a heartbeat for the monitor itself.